\ Infrastructure | dlbuild.net
dlbuild.net
Home Lab Build Log
🧱 Hardware • Services • Monitoring

Lab Infrastructure

Hardware, services, and monitoring stack for dlbuild.net — designed for safe public publishing (static only) while keeping admin endpoints private.

Documented Repeatable Secure defaults Ops-ready

Core nodes

LinuxU Laptop (Admin)

  • SSH / config / docs
  • Primary control node
  • Remote management
Admin SSH Docs

Mini PC Server

  • Ubuntu Server 24.04
  • Docker host
  • Nginx + Monitoring
Ubuntu Docker Nginx

Lab topology

High-level view of the lab network, secure access path, and monitoring stack layout.

dlbuild.net lab topology diagram
Network Architecture Observability

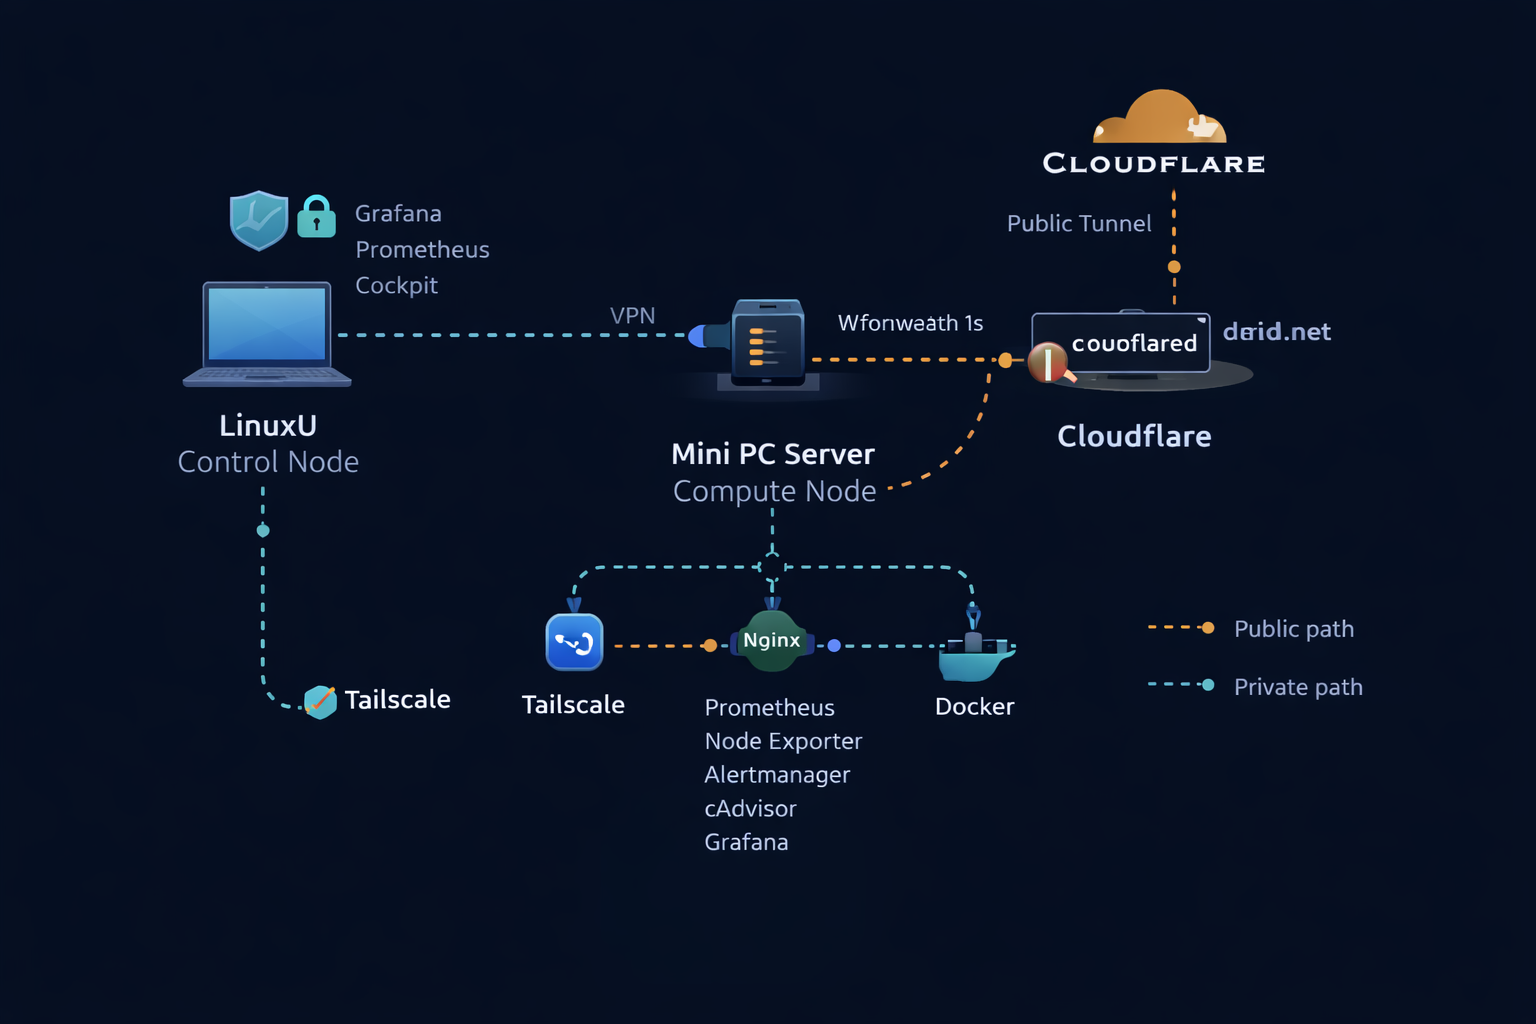
Tip: open image in a new tab to zoom.

NOC display & monitoring stack

Hands-free monitoring console with alerting and kiosk automation.

Stack

  • Prometheus
  • Grafana
  • Alertmanager
  • Node Exporter
  • cAdvisor
Observability Metrics Alerting

Incident summary — GUI drift on monitoring host

During kiosk/GUI experimentation (XFCE/LightDM), the Mini drifted from a headless server posture, introducing login/keyring noise and a confusing secondary user (dashboard). We re-hardened the host by switching the default boot target back to multi-user.target and disabling LightDM, while verifying the monitoring stack remains stable and reachable via Tailscale-only bindings.

  • Symptoms: LightDM / gkr-pam journal errors, unexpected “dashboard” user context.
  • Verification: Docker enabled at boot; all containers set to unless-stopped.
  • Fix: Set default target to headless + disable LightDM; confirm services recovered after reboot.
  • Design note: Grafana/Prometheus bound to IP (Tailscale), not localhost.

Read the full triage note →

Runbook Triage Hardening

Boot flow

Power On → Ubuntu boots (multi-user.target) → Docker starts → Containers auto-recover (unless-stopped) → Monitoring stack available via tailscale
Headless Autostart Service-first

Alerting system

Design

  • Rule-based alerts via Prometheus
  • Mounted rules directory
  • Alertmanager routing
  • Severity tagging
Rules Routing Severity

Active alerts

  • Server Down
  • High CPU
  • High Memory
  • Low Disk

Connectivity & security

  • Tailscale private admin network
  • SSH restricted
  • Nginx public static only
  • No public admin ports
Tailscale Least privilege Static-only

Quick health checks

sudo systemctl status nginx sudo systemctl status docker docker compose ps df -h free -h uptime

Tip: keep these checks “muscle memory.” If something is off, grab logs next and write the verified fix.

Triage Systemd Compose